Some researchers have begun to map structural brain development with growth charts using magnetic resonance imaging (MRI)3, but there has been much less work on comparable charts of early brain function. As we know, brain function also undergoes rapid change in early life, and this ongoing functional development supports emerging behavioral skills. But there has been very limited progress in identifying whether growth charts can be used to map brain function. Additionally, MRI is limited as a tool for scalable public health implementation due to its prohibitive cost and infrastructure. We sought to develop normative growth curves of infant brain function measured with electroencephalogram (EEG)4. EEG is a tool well-suited to this kind of public health developmental context, as it is a scalable, relatively low-cost modality that we can use to measure brain function in humans starting at birth.
We chose to characterize brain function in a key sensory domain: visual neurodevelopment. This domain is important for later visual functioning and may also scaffold later cognitive skills that matter across the lifespan. The visual-evoked potential (VEP) is a robust activity signal that has been measured across species and may reflect features of the neural architecture, such as myelination and underlying cortical circuit function. It can be collected with EEG while an infant watches a visual stimulus, like a flashing checkerboard. Even in infancy, the VEP has a canonical waveform, characterized by an initial negative peak (N1), a later positive peak (P2), and a final negative peak (N2), as shown in the bottom right panel of Figure 1.
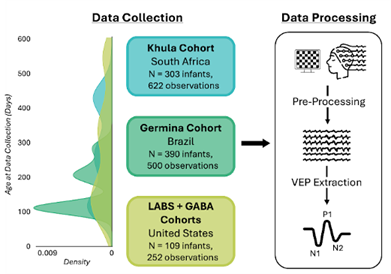
Figure 1: Study Overview. 128-channel EEG data were collected in 802 infants (n=1374 EEG observations) between 57 and 579 days old across three continents. These data were a priori harmonized for paradigm, acquisition, and processing parameters across sites. Standard processing was used to extract the visual-evoked potential (VEP) from the EEG data and measure the amplitudes and latencies of the N1, P1, and N2 peaks. We created growth curves for each amplitude and latency.
We collected standardized EEG VEPs from 802 infants (ages 57 to 579 days old) from four longitudinal cohorts across three global sites (i.e., Cape Town, South Africa; São Paulo, Brazil; and Boston, USA), resulting in 1374 observations. These sites represent distinct cultural, linguistic (i.e., primarily speaking Xhosa, Brazilian Portuguese, and English, respectively), geographic, and socioeconomic contexts. For example, the socioeconomic diversity can be seen as more than 60% of the caregivers in the South Africa cohort reported an annual household income of less than $3,303 (60,000 ZAR); whereas 10.3% in the Brazil cohort fell under an HHI of $4,763 ($27,600 Brazilian Real) and only 5.4% in the US cohort reported making $50,000 or less. These differences allowed us to test whether developmental trajectories generalize across markedly different settings.
We developed growth curves for the different EEG signal components of this visual response. After extracting VEP waveforms from the EEG data, they can be characterized by the amplitudes (i.e., heights) and latencies (i.e., times from stimulus onset to peak) of the N1, P1, and N2 peaks. Growth curves for each of these parameters were created. Our modeling approach applied GAMLSS5 (generalized additive models of location, scale, and shape), a flexible centile-modeling method that can capture complex nonlinear trajectories and has been used in growth-chart work (see Figure 2). This approach creates flexible centile curves similar to those used in WHO growth standards. However, given the diversity of our three sites, we sought to test whether the developmental patterns we observed were similar across the distinct populations. When we modeled visual neurodevelopment features in two of the sites, we successfully applied the model to the held-out site, suggesting that these developmental trajectories were similar across populations.
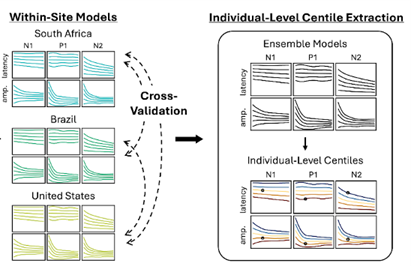
Figure 2: Modeling Overview. We independently trained GAMLSS curves for each site and VEP feature (i.e., N1, P1, and N2 amplitudes and latencies). The GAMLSS curves were generalized across sites, indicating that a curve trained on the Boston data was valid for the Cape Town data. Individual centiles were extracted and linked to cognitive scores from a global public health measure (Global Scales of Early Development, Long Form).
Individual centile scores on these growth curves may also associate with broader cognitive development. We found that deviations from these trajectories were associated with Global Scales for Early Development scores, a WHO-developed measure of general development, in the South Africa cohort. Higher centile scores were associated with higher developmental scores at two years of age.
Our research suggests that key VEP developmental patterns are similar across these populations, despite substantial environmental, genetic, and cultural differences. Beyond this cross-site consistency, the VEP is a promising metric of neurodevelopment because of its accessibility. It can be collected in newborns using a simple, portable, and relatively low-cost EEG paradigm. This allows for greater diversity in both the data used to train the models and the settings where this technology could be deployed. Open-source preprocessing software, such as Harvard Automated Preprocessing Pipeline for EEG6 (HAPPE; https://github.com/PINE-Lab/HAPPE), can also facilitate standardized processing of EEG data. We have integrated our growth curves from the current dataset into HAPPE, making it easier to extract centile scores from new participants. We hope to continue updating these models as more data are collected and to improve our understanding of how the VEP relates to broader cognitive development. With further replication and prospective validation, VEP growth curves may provide a scalable framework for characterizing atypical developmental trajectories. In the future, they may help identify critical periods and support the assessment of intervention-related change.
Want to learn more about this study? Read our preprint here: https://doi.org/10.1101/2025.03.25.645314
1 Group, W. M. G. R. S. WHO Child Growth Standards based on length/height, weight and age. Acta Paediatr Suppl 450, 76-85 (2006). https://doi.org/10.1111/j.1651-2227.2006.tb02378.x
2 Kuczmarski, R. J. et al. 2000 CDC Growth Charts for the United States: methods and development. Vital Health Stat 11, 1-190 (2002).
3 Bethlehem, R. A. I. et al. Brain charts for the human lifespan. Nature 604, 525-533 (2022). https://doi.org/10.1038/s41586-022-04554-y
4 Margolis, E. T. et al. Growth charts of infant visual neurodevelopment generalize across global contexts. bioRxiv, 2025.2003.2025.645314 (2025). https://doi.org/10.1101/2025.03.25.645314
About the Author

Emma T. Margolis
Northeastern University
Emma T. Margolis, MS, is a PhD candidate at Northeastern University. Her research focuses on how the perinatal environment shapes early neuroplasticity mechanisms, giving rise to individual differences in brain and behavioral outcomes.
X: @emma_margolis
Bluesky: @emma-margolis.bsky.social

Chris C. Camp
Yale University
Chris C. Camp is a PhD student in the Interdepartmental Neuroscience Program at Yale University. Their work aims to improve statistical approaches to neuroimaging analysis across a range of applications, including development and psychiatry.
X: @chrisclaycamp
Bluesky: @chrisclaycamp.bsky.social

Dustin Scheinost, PhD
Yale Biomedical Imaging Institute
Dustin Scheinost, PhD, is an Associate Professor of Radiology & Biomedical Imaging, Biomedical Engineering, Statistics & Data Science, and in the Child Center. He is the Associate Director, Biomedical Imaging Technology for the Yale Biomedical Imaging Institute and a founder of the Fetal, Infant, & Toddler Neuroimaging Group (FIT’NG; https://fitng.org/). His research focuses on creating and using cutting-edge statistical methods in fetal, infant, and toddler neuroimaging.
X: @Dscheinost
Bluesky: @dscheinost.bsky.social

Laurel J. Gabard-Durnam, PhD
Plasticity in Neurodevelopment (PINE) Lab
Laurel J. Gabard-Durnam, PhD, is the Director of the Plasticity in Neurodevelopment (PINE) Lab, Assistant Professor in the Department of Psychology, and Associate Director of the Institute for Cognitive and Brain Health at Northeastern University. Her research focuses on how different environments and neuroplasticity interact to shape brain and behavior development.
X: @laurel_joy_gd
Bluesky: @laurelgd.bsky.social